Introduction
Understanding fan curve charts is essential for electronics engineers who navigate the complexities of cooling solutions. These charts illustrate the intricate relationship between airflow, static pressure, and fan speed, empowering professionals to make informed decisions that enhance system efficiency and performance. However, with numerous variables at play, how can engineers ensure they select the right fans for their specific applications?
This article delves into ten essential insights that unravel the intricacies of fan curve charts. By offering valuable guidance for optimizing cooling designs, we aim to drive innovation in electronic systems.
As we explore these insights, engineers will gain a clearer understanding of how to leverage fan curve charts effectively, ensuring their cooling solutions are not only efficient but also tailored to meet the demands of their unique applications.
Gagner-Toomey Associates: Innovative Solutions for Understanding Fan Curve Charts
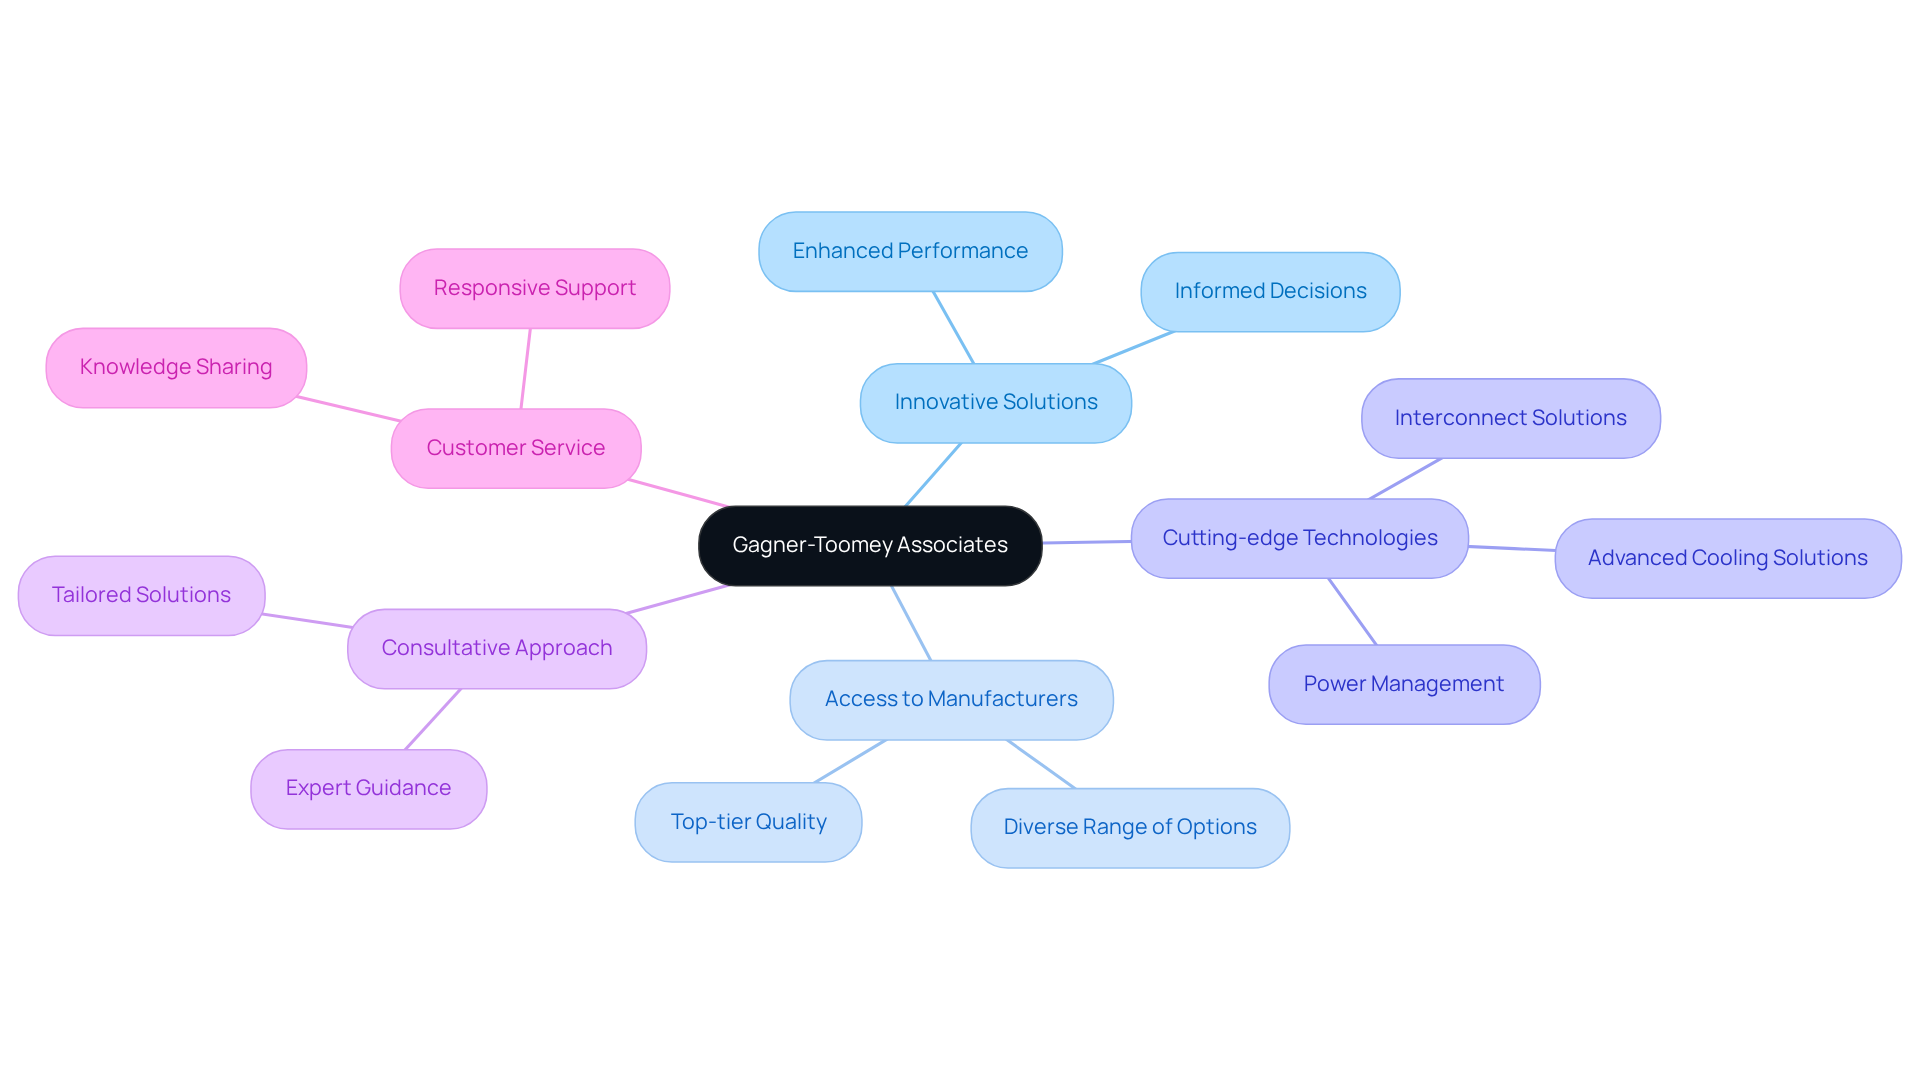
Gagner-Toomey Associates addresses the challenges professionals face when navigating the complexities of fan curve charts. By providing access to a diverse range of top-tier manufacturers and cutting-edge technologies in cooling, power management, and interconnect solutions, Gagner-Toomey empowers professionals to make informed decisions that enhance performance and efficiency in electronic systems.
Their consultative approach, combined with a commitment to responsive customer service, ensures that technicians are equipped with the necessary tools and knowledge to optimize fan selection and application across various projects. This dedication not only simplifies the decision-making process but also drives significant improvements in system performance.
In a field where precision and reliability are paramount, Gagner-Toomey Associates stands out as a trusted partner. Their expertise and resources enable clients to navigate the intricacies of fan curve charts with confidence, ultimately resulting in superior outcomes in their electronic systems.
Understanding Fan Curves: The Basics Every Engineer Must Know
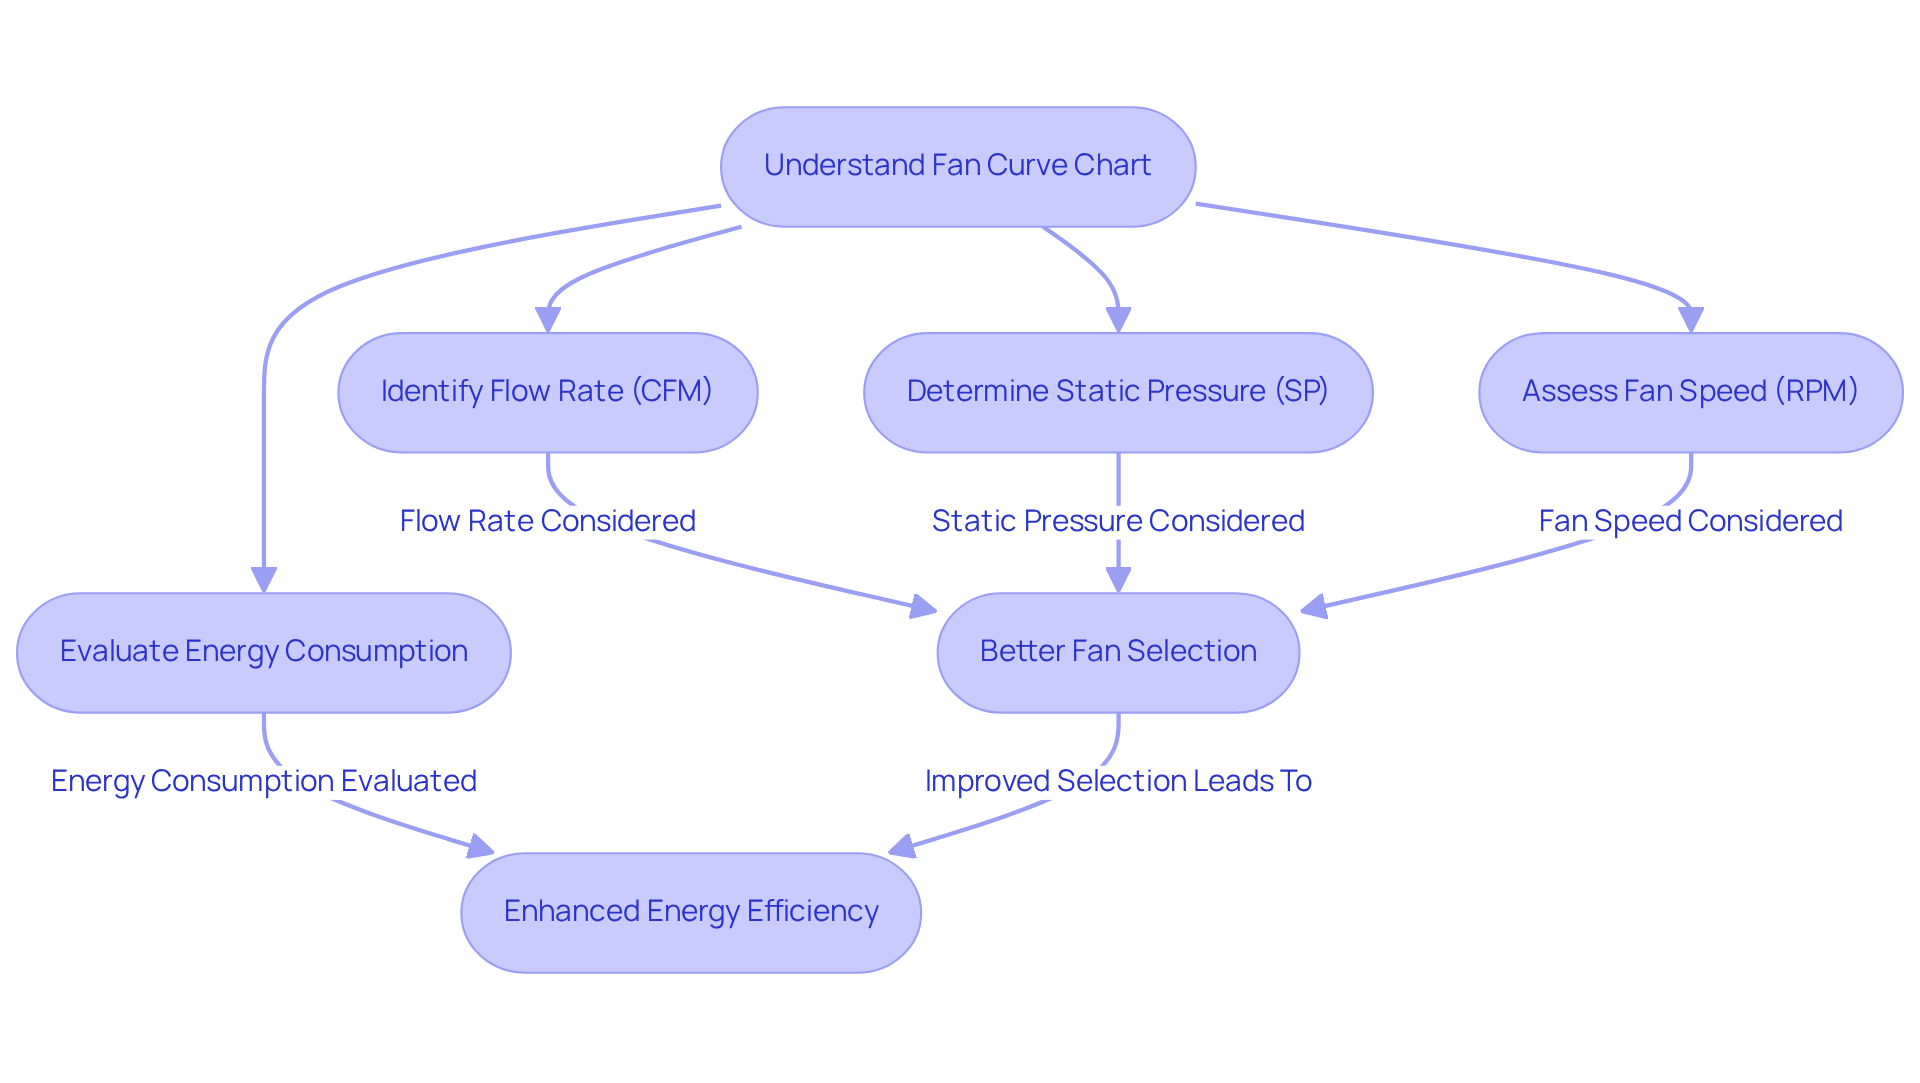
The fan curve chart serves as a crucial visual tool that illustrates the relationship between flow rate (CFM), static pressure (SP), and fan speed (RPM), making it indispensable for engineers in the electronics industry. These curves delineate the maximum air movement achievable at varying static pressures, facilitating precise fan selection tailored to specific system requirements.
Consider the insights of Tim De Stasio, who notes that a mere 10% increase in air movement necessitates a 33% rise in horsepower. This example underscores the significant impact of fan choice on energy consumption. Additionally, the Fan Energy Index (FEI) emerges as a vital metric for engineers, aiding in the identification of energy-efficient blowers that enhance overall performance.
Understanding the fan curve chart is paramount, as it directly influences airflow dynamics and static pressure within electronic devices. A comprehensive grasp of fan performance metrics not only assists in selecting the appropriate fans but also inspires innovative cooling designs that bolster the reliability and longevity of electronic components.
Evaluating cooling demands is essential to ensure that fan selections align with specific system requirements. By mastering the fan curve chart, engineers can adeptly navigate the complexities of cooling solutions, ensuring optimal performance in their applications.
The Three Fan Laws: Key Principles for Fan Performance Analysis
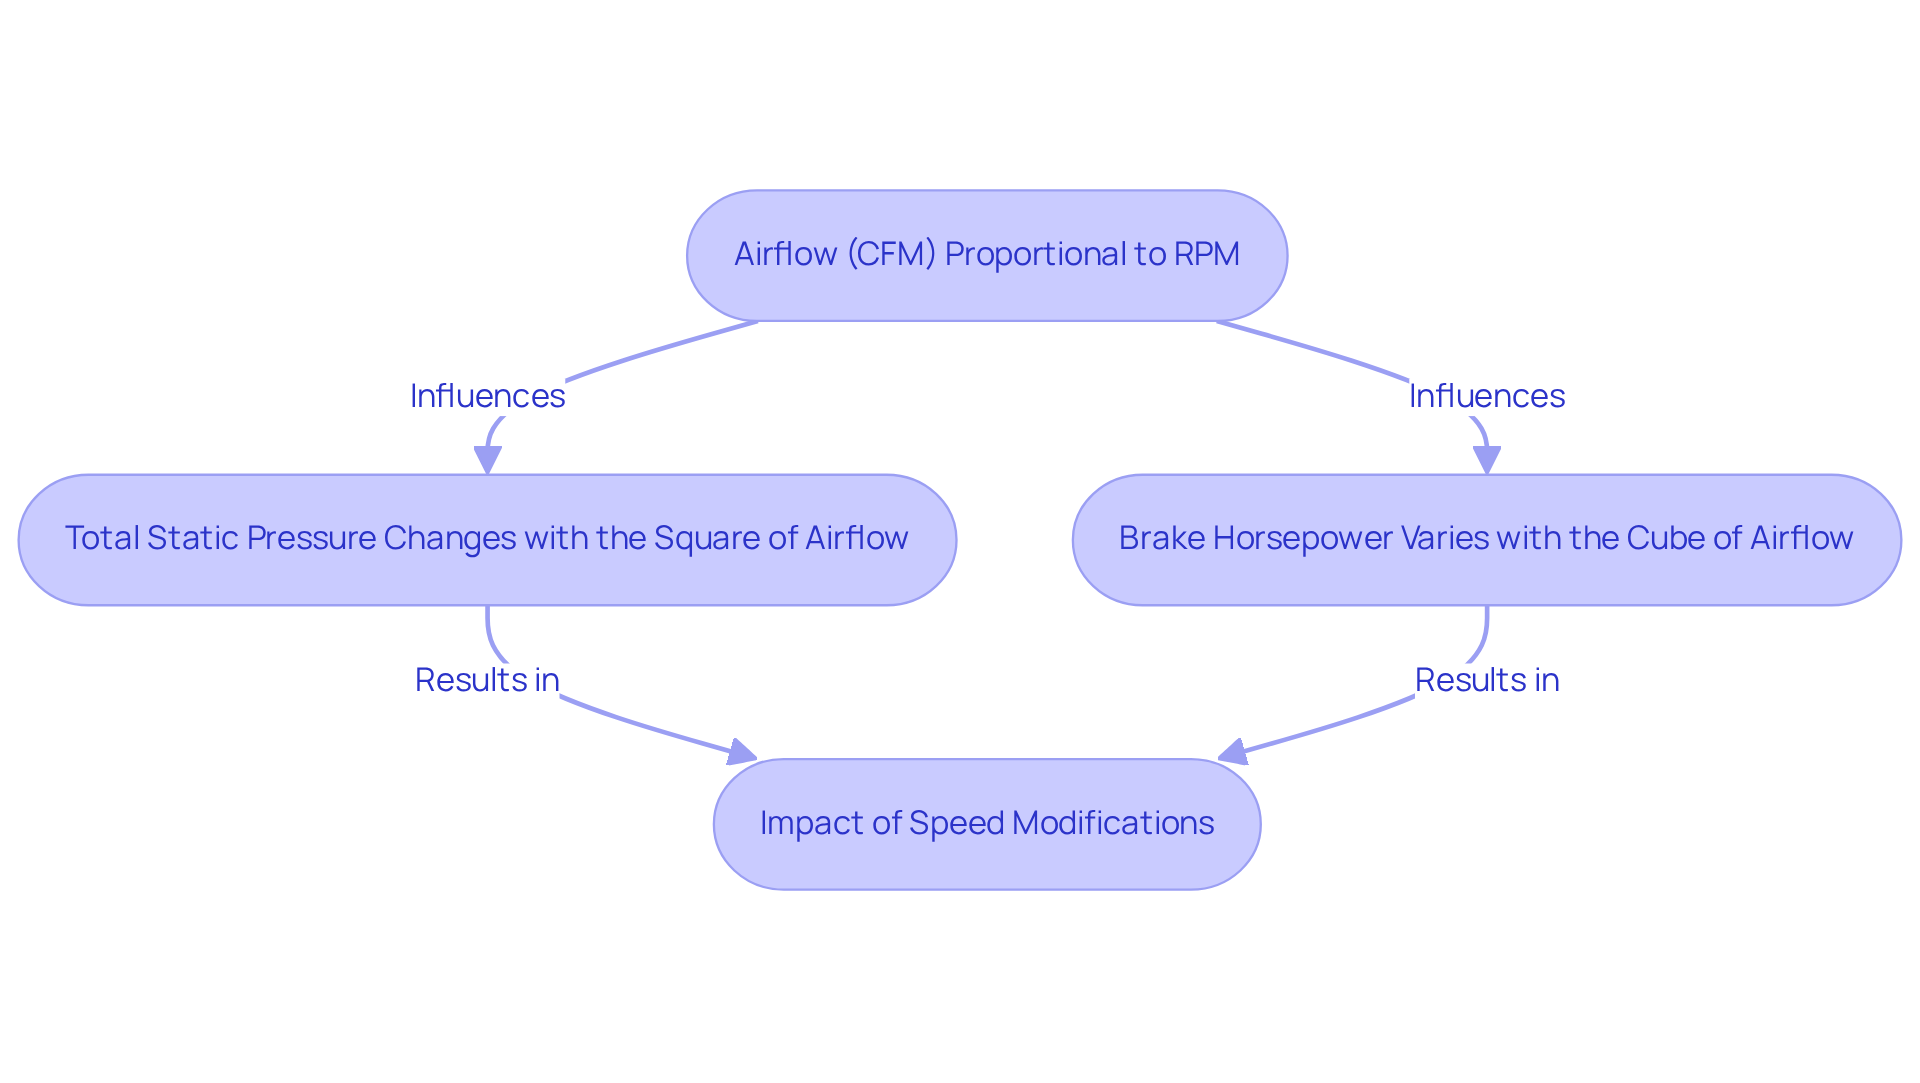
Understanding the three fan laws is crucial for analyzing fan performance:
- Airflow (CFM) is directly proportional to RPM.
- Total static pressure changes with the square of the airflow (or RPM).
- Brake horsepower (BHP) varies with the cube of the airflow.
For instance, increasing fan speed by 10% results in a 33% increase in power and a 21% rise in static pressure. This illustrates the significant impact that speed modifications have on performance. Additionally, enhancing the volume flow capacity of an existing setup leads to a 33% increase in power supply, underscoring the energy implications of fan speed adjustments.
These principles empower engineers to predict how changes in fan speed will affect air movement and pressure, facilitating the design of efficient systems that adapt to varying operational conditions. Practical applications, as highlighted in case studies on variable speed fans, demonstrate that a solid grasp of these principles can yield substantial energy savings and improved reliability, particularly in electronic devices where precise air management is vital.
As Tim De Stasio, an HVAC Ventilation Specialist, aptly states, “Ultimately, a service technician should be able to understand the 3 Fan Laws to be more precise when making adjustments to air movement.” Furthermore, identifying the Operating Point is essential, as it marks the intersection of static pressure and air movement on the fan curve chart, which aids professionals in optimizing performance.
Static Pressure: A Critical Factor in Fan Curve Analysis
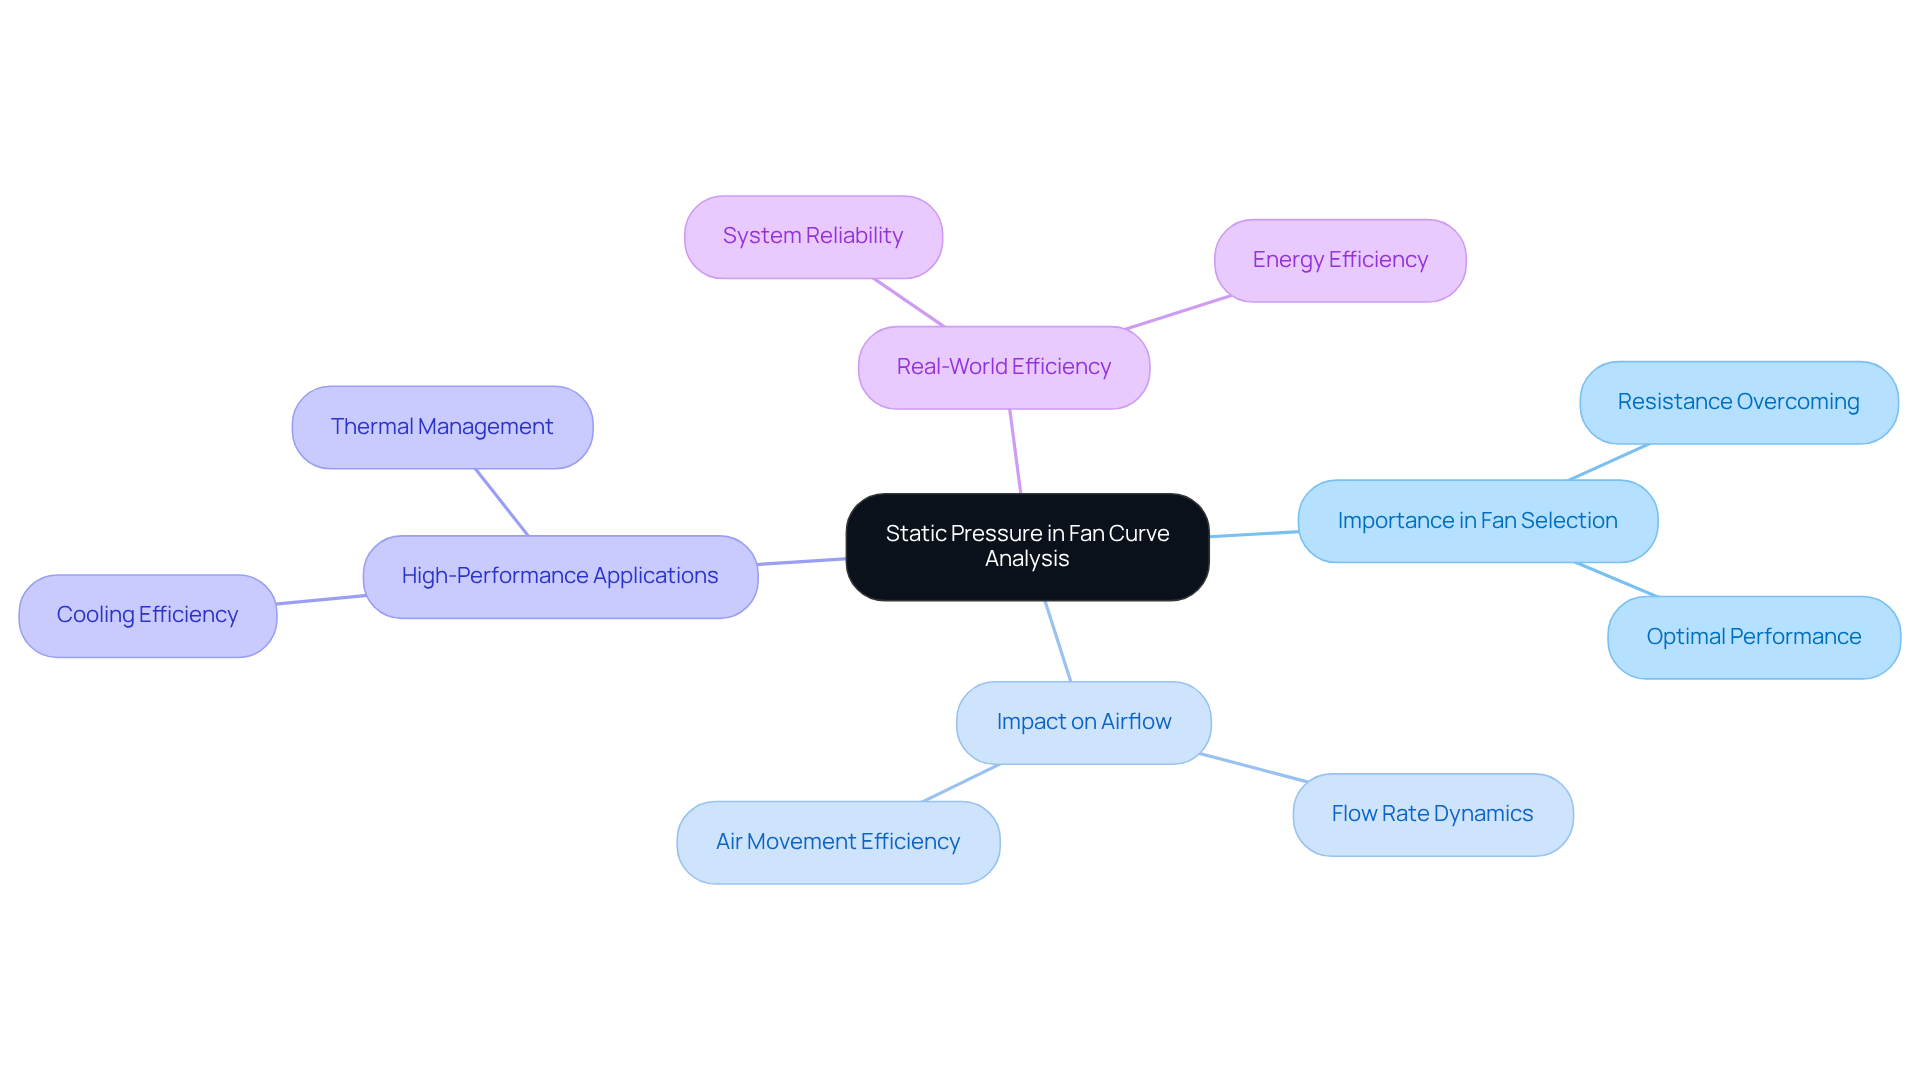
Static pressure is a critical factor that indicates the resistance a fan must overcome to effectively move air through a system. This resistance plays a vital role in the fan curve chart analysis, as it directly influences a fan’s ability to provide adequate ventilation. Engineers must meticulously evaluate the static pressure requirements of their systems during fan selection to ensure optimal performance.
In high-performance computing environments, where rapid heat dissipation is paramount, fans designed to generate substantial static pressure are essential. These fans can maintain optimal airflow even in confined spaces, such as those equipped with filters or heatsinks. For instance, statistics reveal that a mere 0.1 difference in flow rate (measured in cubic meters per second) requires a corresponding 0.4 inches of water pressure difference at the knee of the fan curve chart. This highlights the delicate balance between gas movement and static pressure.
Real-world applications demonstrate that professionals who prioritize static pressure in their designs can significantly enhance cooling efficiency. This focus ensures reliable performance across various electronic systems. Understanding the interplay between static pressure and airflow is crucial for optimizing cooling solutions, as it directly affects thermal management and energy efficiency. By recognizing the importance of static pressure, engineers can make informed decisions that lead to superior system performance.
Brake Horsepower: Understanding Energy Efficiency in Fan Operations
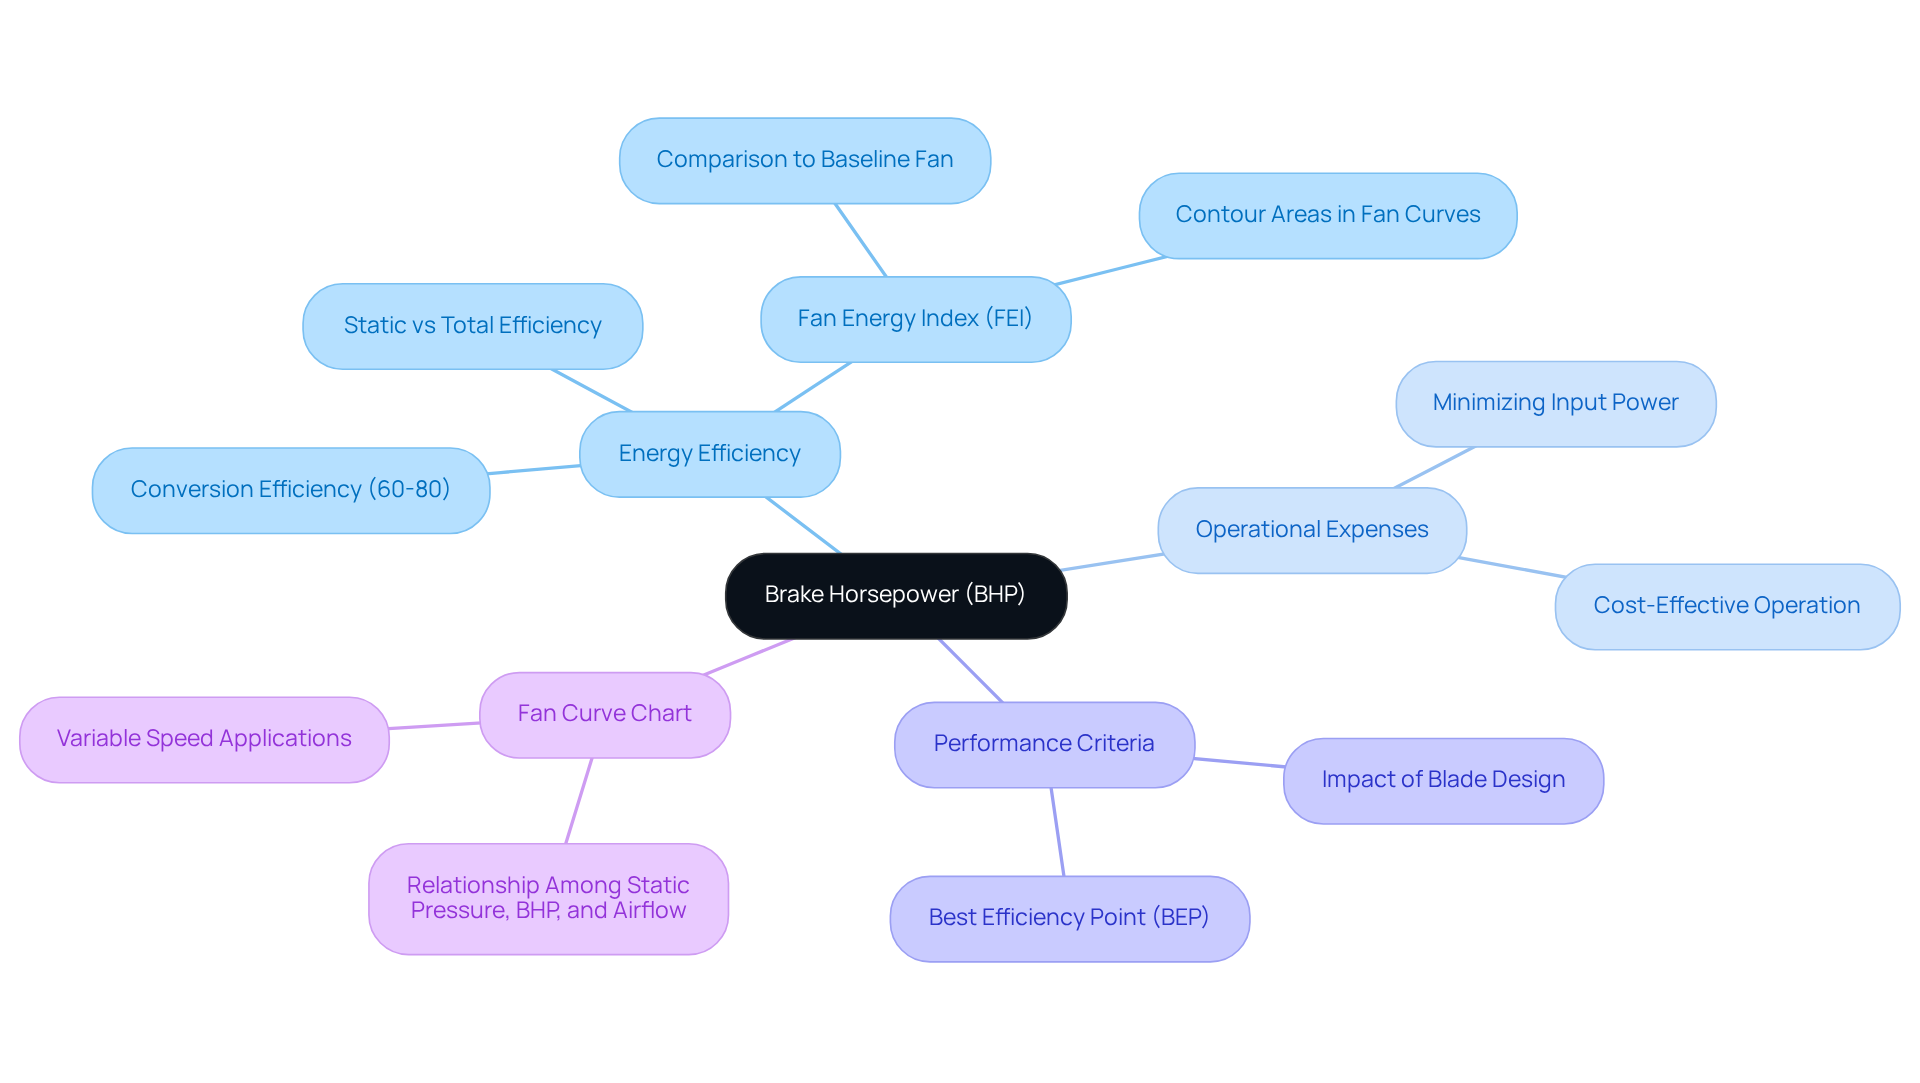
Brake horsepower (BHP) is a critical metric that measures the actual power required to operate a fan at its current operating point. Unlike simple horsepower ratings, BHP accounts for losses due to friction and other factors, providing a more accurate representation of energy consumption. Understanding BHP is essential for professionals who aim to select energy-efficient fans that not only reduce operational expenses but also meet performance criteria.
By examining BHP in conjunction with the fan curve chart, professionals can make informed choices that significantly enhance efficiency. This knowledge empowers them to optimize their systems, ensuring that they achieve the desired performance while minimizing energy costs. In the competitive landscape of energy management, leveraging BHP effectively can lead to substantial savings and improved operational outcomes.
System Curves: Integrating Fan Performance with System Requirements
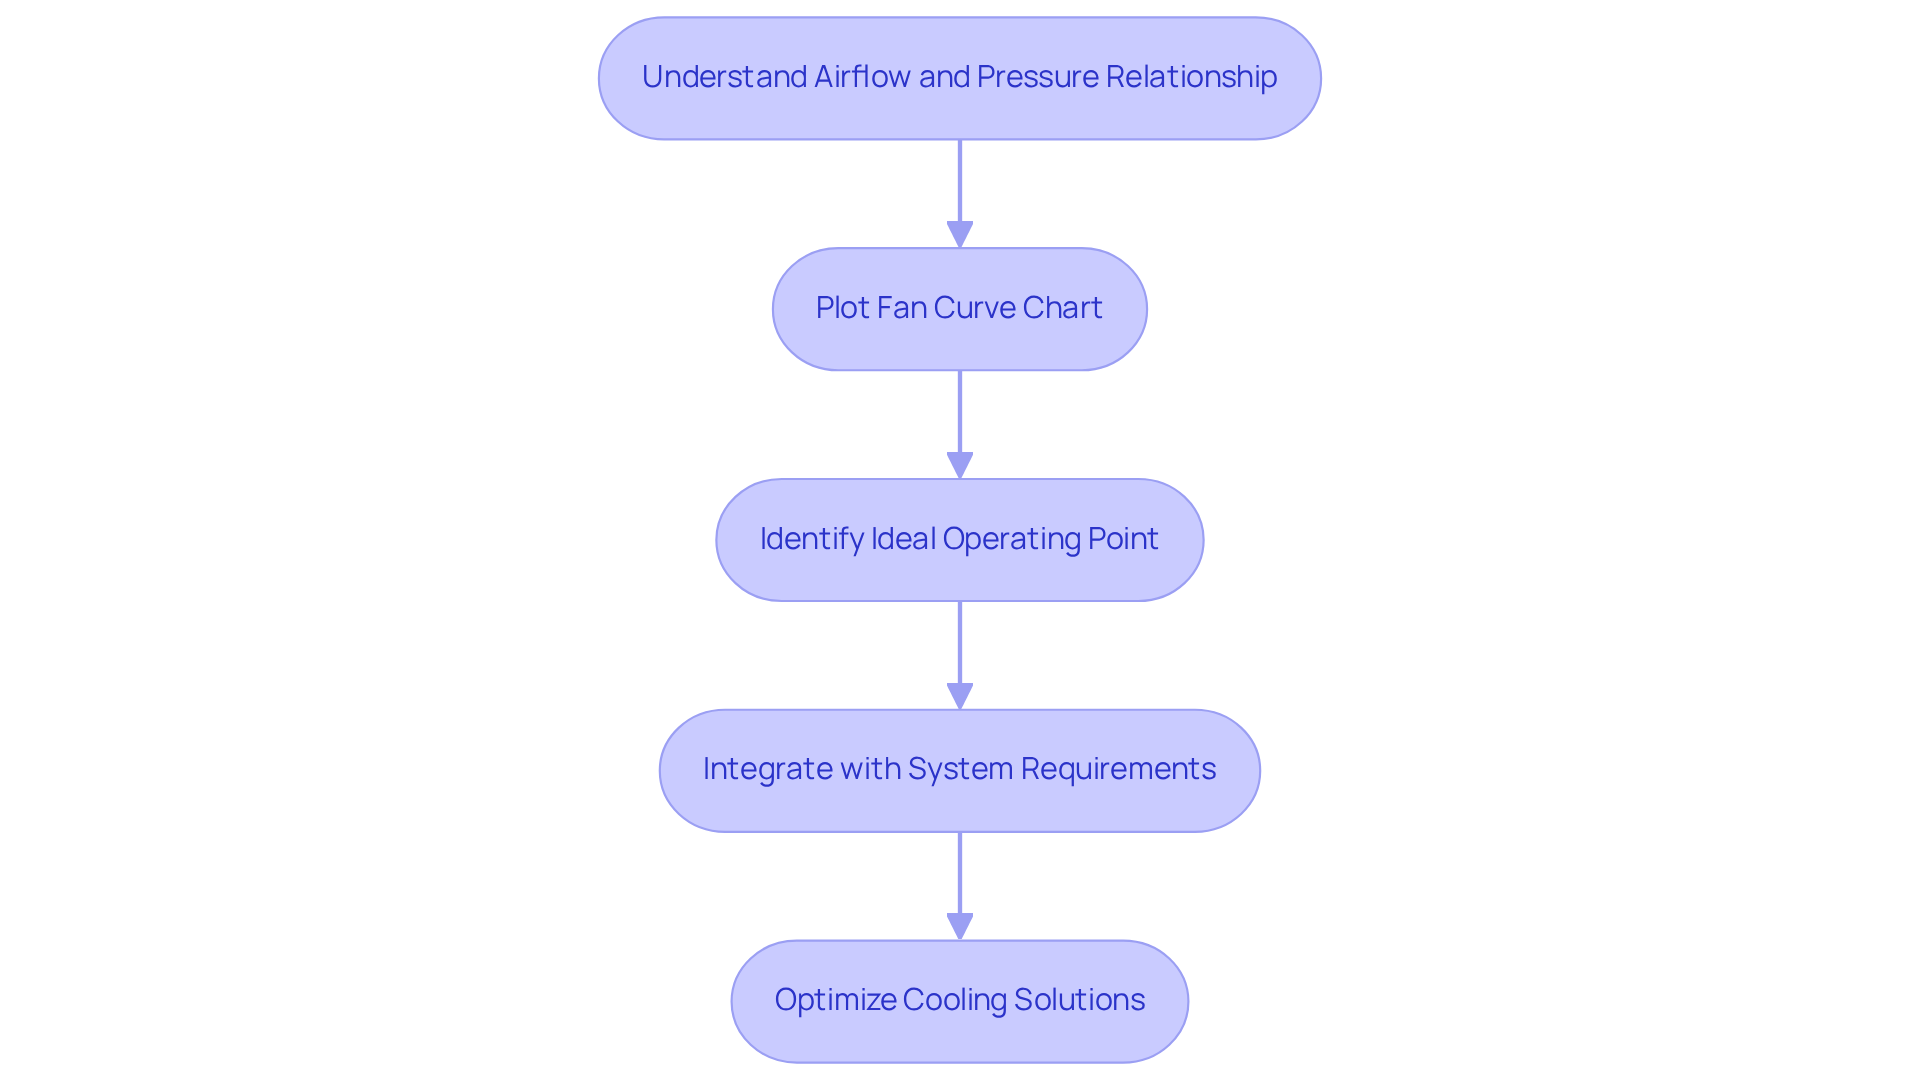
Understanding the relationship between airflow and the pressure required to transport that airflow through a network is crucial for optimizing fan performance. By plotting these curves alongside the fan curve chart, specialists can identify the ideal operating point for their fans. This integration is essential for ensuring that the selected fan meets the specific requirements of the setup, ultimately enhancing performance and energy efficiency.
Understanding the fan curve chart enables technical specialists to create more efficient cooling solutions in electronic applications. For instance, when a fan operates at its optimal point, it not only maximizes airflow but also minimizes energy consumption, leading to significant cost savings over time.
Incorporating this knowledge into design processes can transform cooling strategies, making them more effective and sustainable. Therefore, it is imperative for professionals in the field to leverage performance curves to drive innovation and efficiency in their cooling systems.
Variable Speed Fan Curves: Enhancing Flexibility in Fan Design
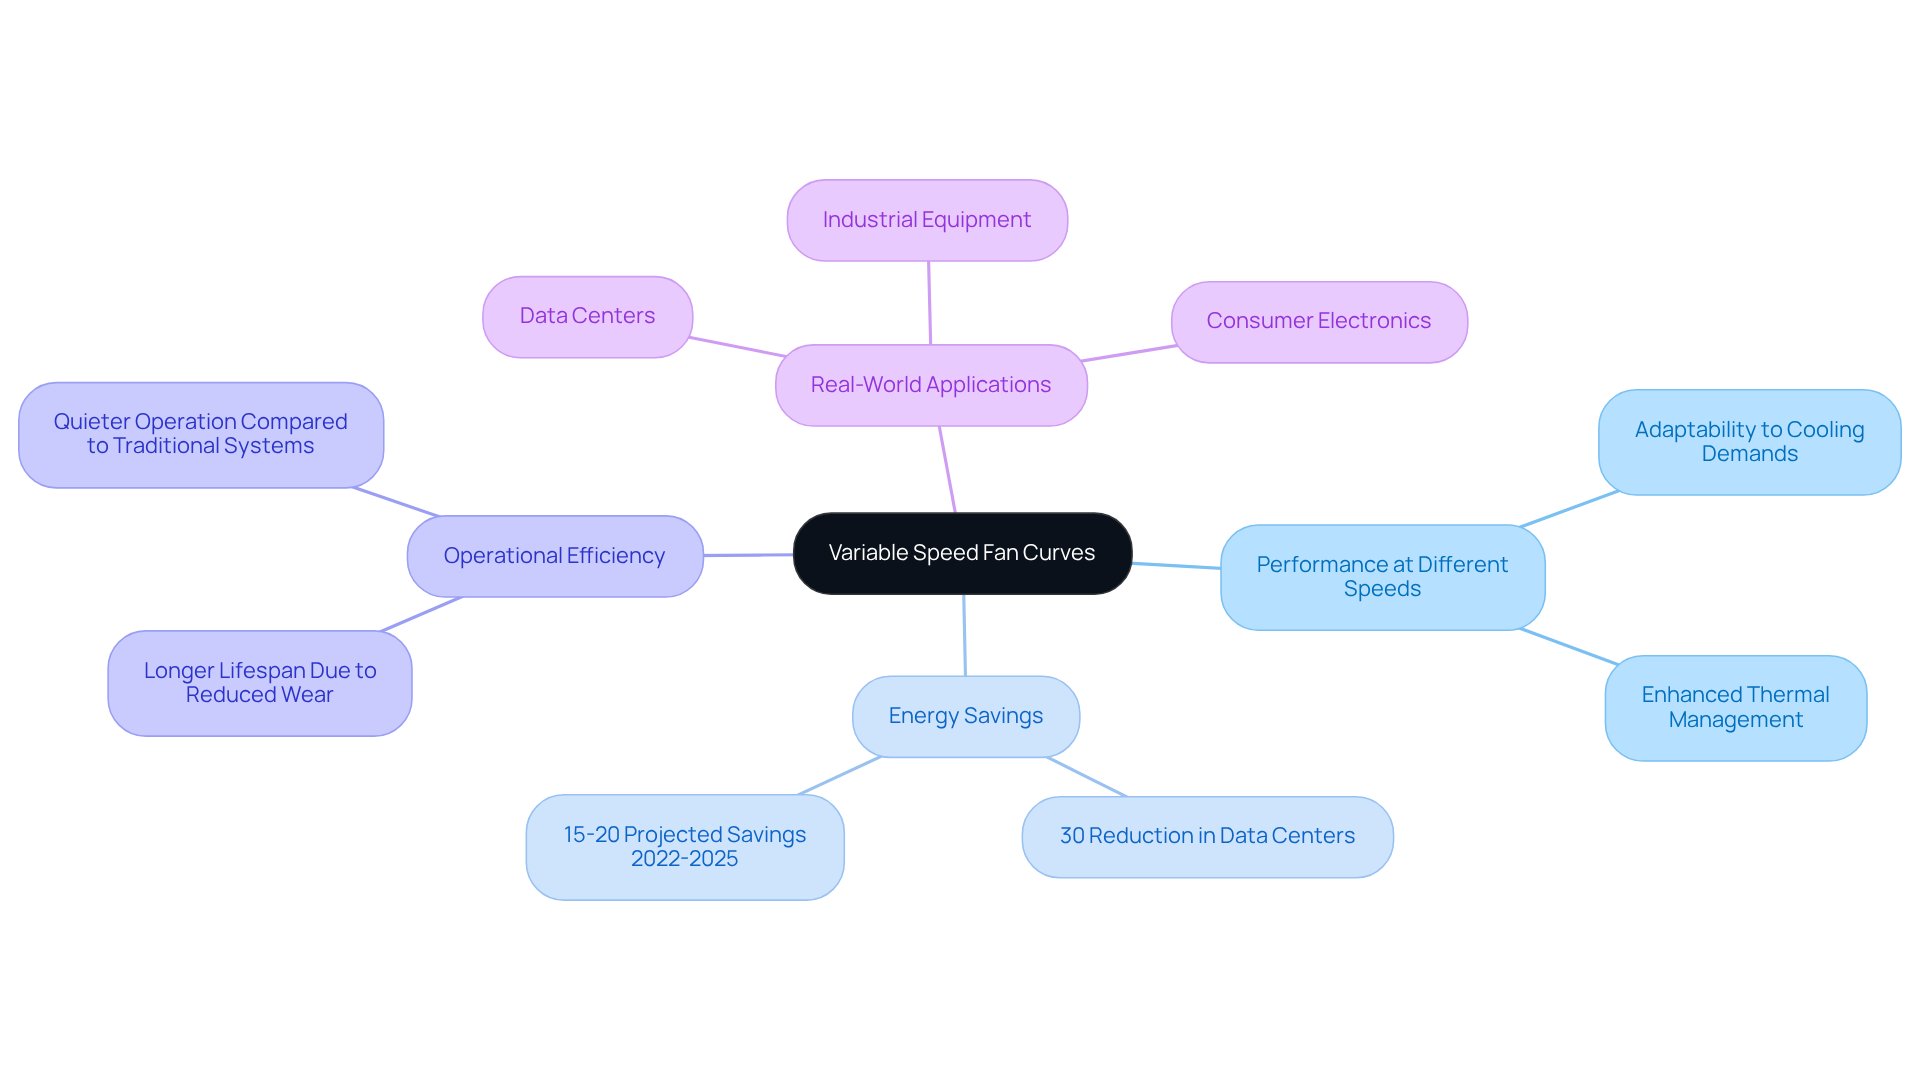
The fan curve chart illustrates how variable speed fan performance varies at different speeds, empowering engineers to tailor air movement to specific requirements. This adaptability is essential in environments where cooling demands can shift rapidly, allowing for optimized energy consumption and enhanced thermal management.
For instance, advanced cooling systems can decrease data center energy usage by as much as 30%. Furthermore, adjustable speed blowers are projected to achieve energy reductions of 15-20% from 2022 to 2025 by effectively regulating airflow. These devices not only operate more quietly than traditional systems, contributing to a more pleasant working environment, but they also tend to have a longer lifespan due to reduced wear from frequent starts and stops.
Real-world applications, particularly in data centers, underscore the significance of high-efficiency variable speed devices in boosting operational efficiency. As the demand for energy-efficient solutions escalates, the integration of variable speed fans becomes increasingly crucial in meeting sustainability objectives while ensuring effective cooling performance.
Fan Efficiency Curves: Optimizing Performance for Engineering Applications
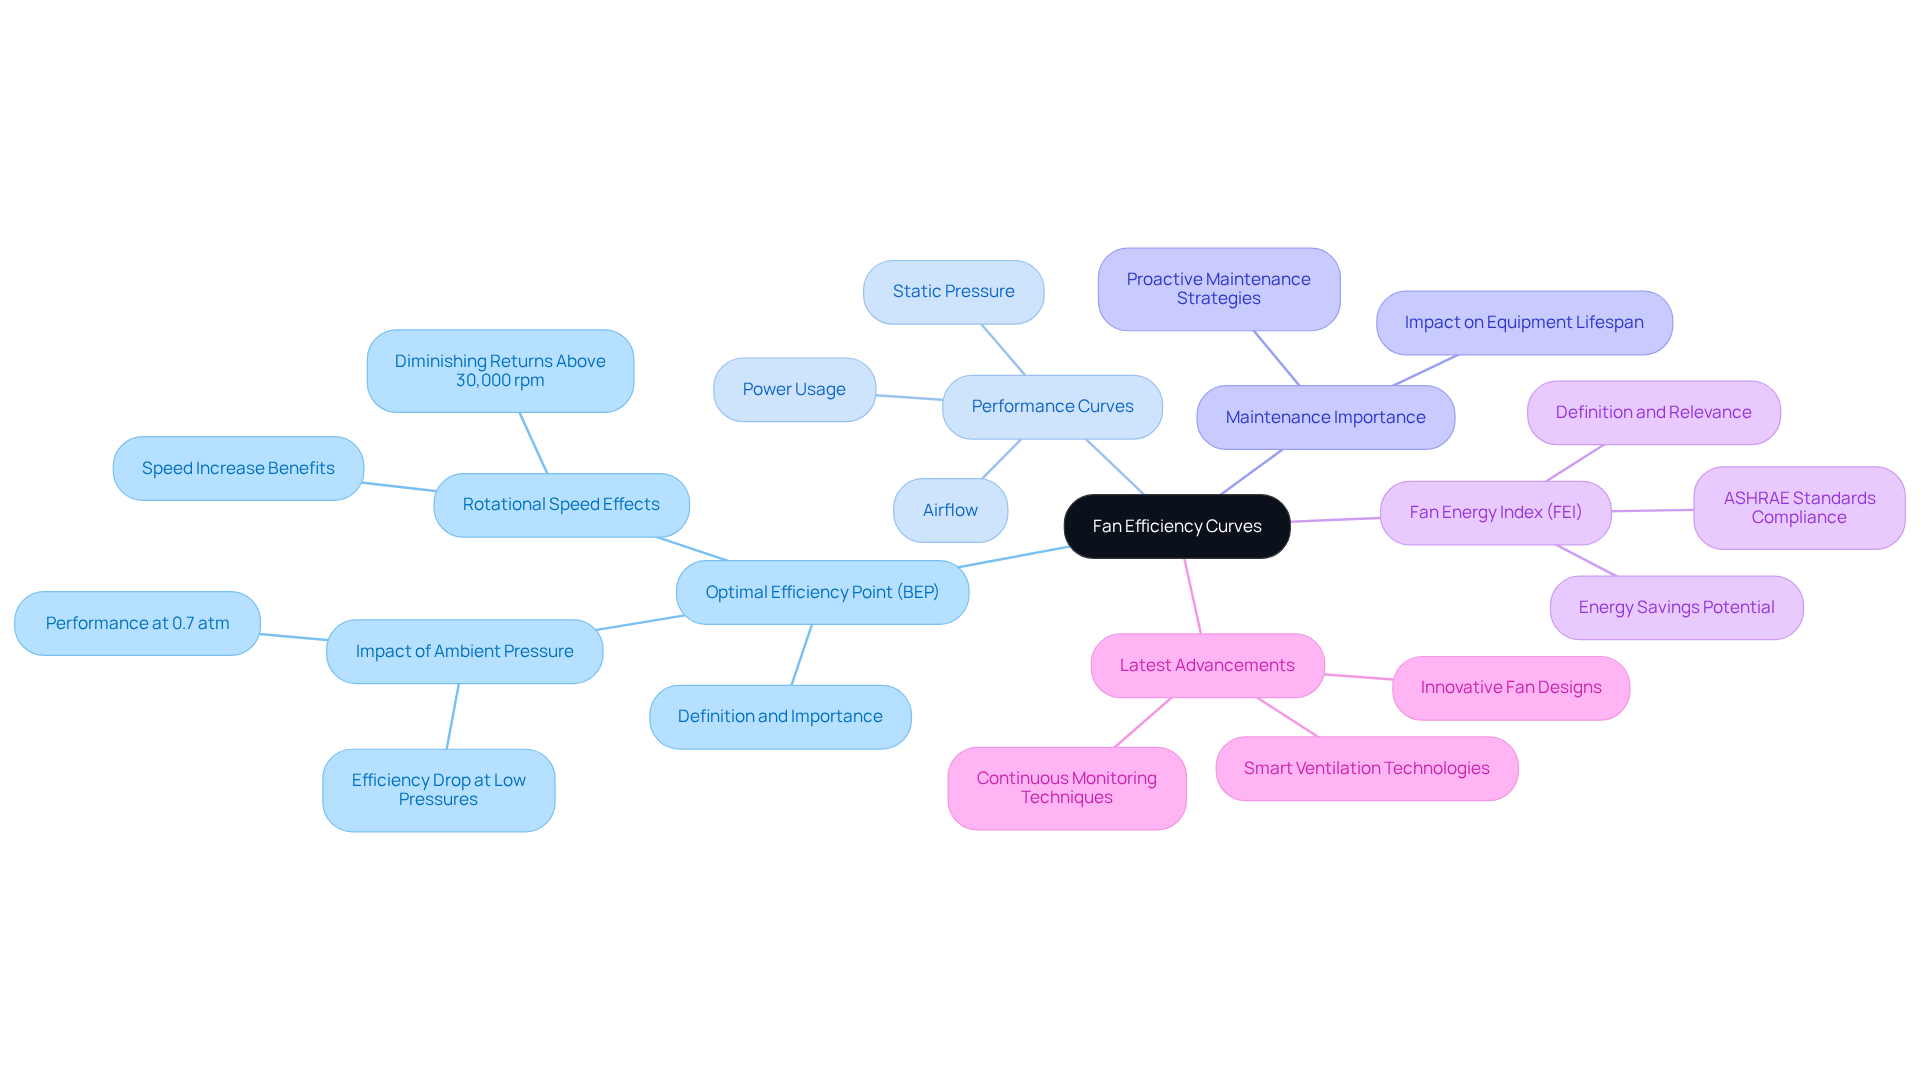
The fan curve chart serves as a crucial visual tool, illustrating how effectively a fan converts input power into air movement. Understanding the fan curve chart is essential for professionals aiming to identify the optimal efficiency point (BEP) where a fan operates most economically. By analyzing blower efficiency alongside performance curves – considering airflow, static pressure, and power usage – professionals can select devices that not only meet airflow requirements but also minimize energy consumption. This leads to more sustainable and cost-effective designs.
Moreover, proactive maintenance of fans is vital for maintaining performance and extending equipment lifespan, especially when operating near the BEP. Recognizing the significance of the Fan Energy Index (FEI) is equally important for assessing fan efficiency in accordance with the latest ASHRAE standards. Real-world examples illustrate how professionals have effectively leveraged fan curve charts and efficiency curves to make informed decisions, ensuring their fan selections align with both performance needs and energy efficiency goals.
Staying updated on the latest advancements regarding BEP in fan technology is essential for professionals who aspire to implement cutting-edge solutions in their projects.
Applying Fan Curve Charts: Selecting the Right Equipment for Your Needs
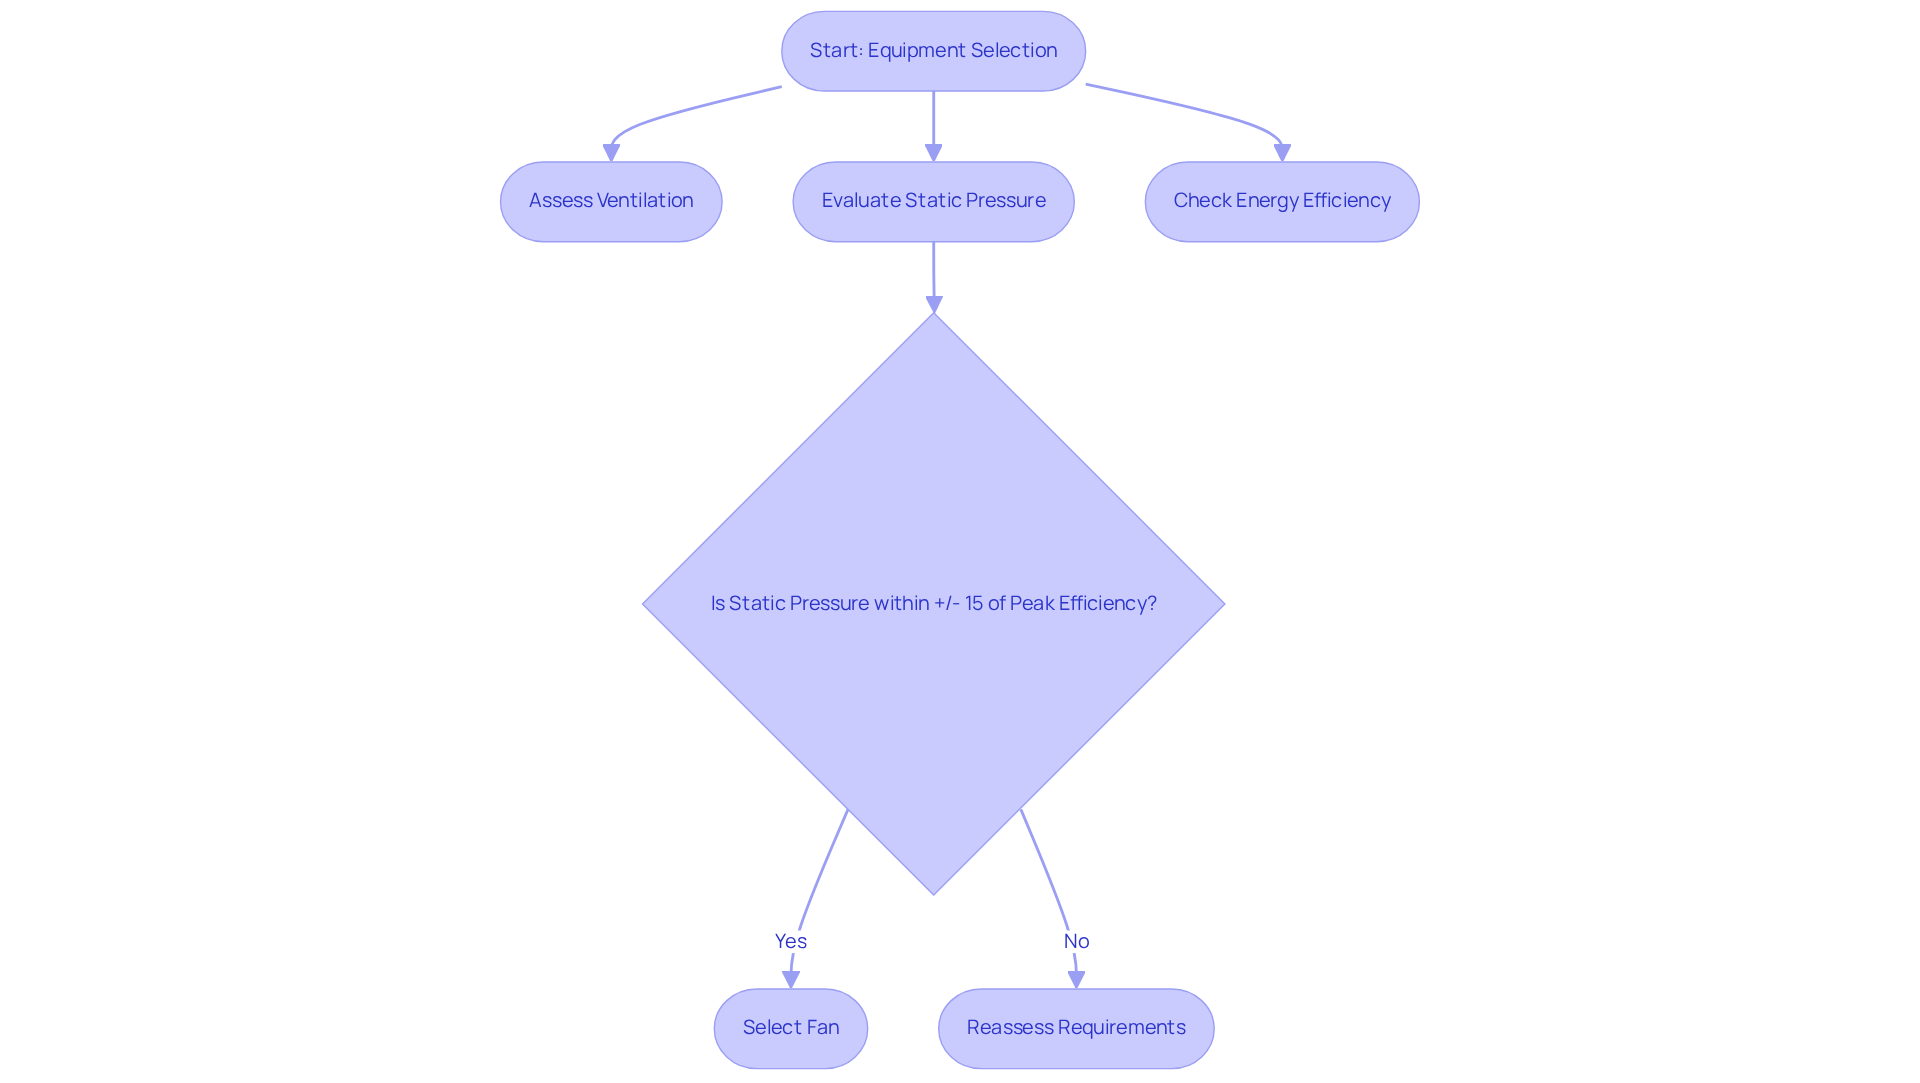
For engineers aiming to align project specifications with optimal fan performance characteristics, applying fan curve charts is crucial. Key elements such as ventilation, static pressure, and energy efficiency must be thoroughly assessed during the selection process. A case study on duty point selection underscores the importance of operating within +/- 15% of peak efficiency to avoid inefficiencies and potential damage to the fan apparatus.
Understanding the relationship between static pressure and air movement is vital; increased static pressure can significantly reduce air movement, adversely affecting overall performance. Engineers must also recognize the stall region on the fan curve, as operating in this area can lead to instability, vibration, and noise issues that should be avoided for reliable operation.
By effectively utilizing fan curve charts, professionals can make informed decisions that enhance reliability and efficiency, ultimately resulting in improved project outcomes. Recent advancements in fan selection software, such as QUIPS, streamline this process by allowing professionals to input specific requirements, including air movement and static pressure, and receive tailored fan options that prioritize efficiency and performance.
Moreover, changes in the air distribution network can alter the curve of the setup, impacting fan performance and output capacity. Therefore, it is essential to consider these factors during the selection process.
Mastering Fan Curve Charts: Essential Knowledge for Every Engineer
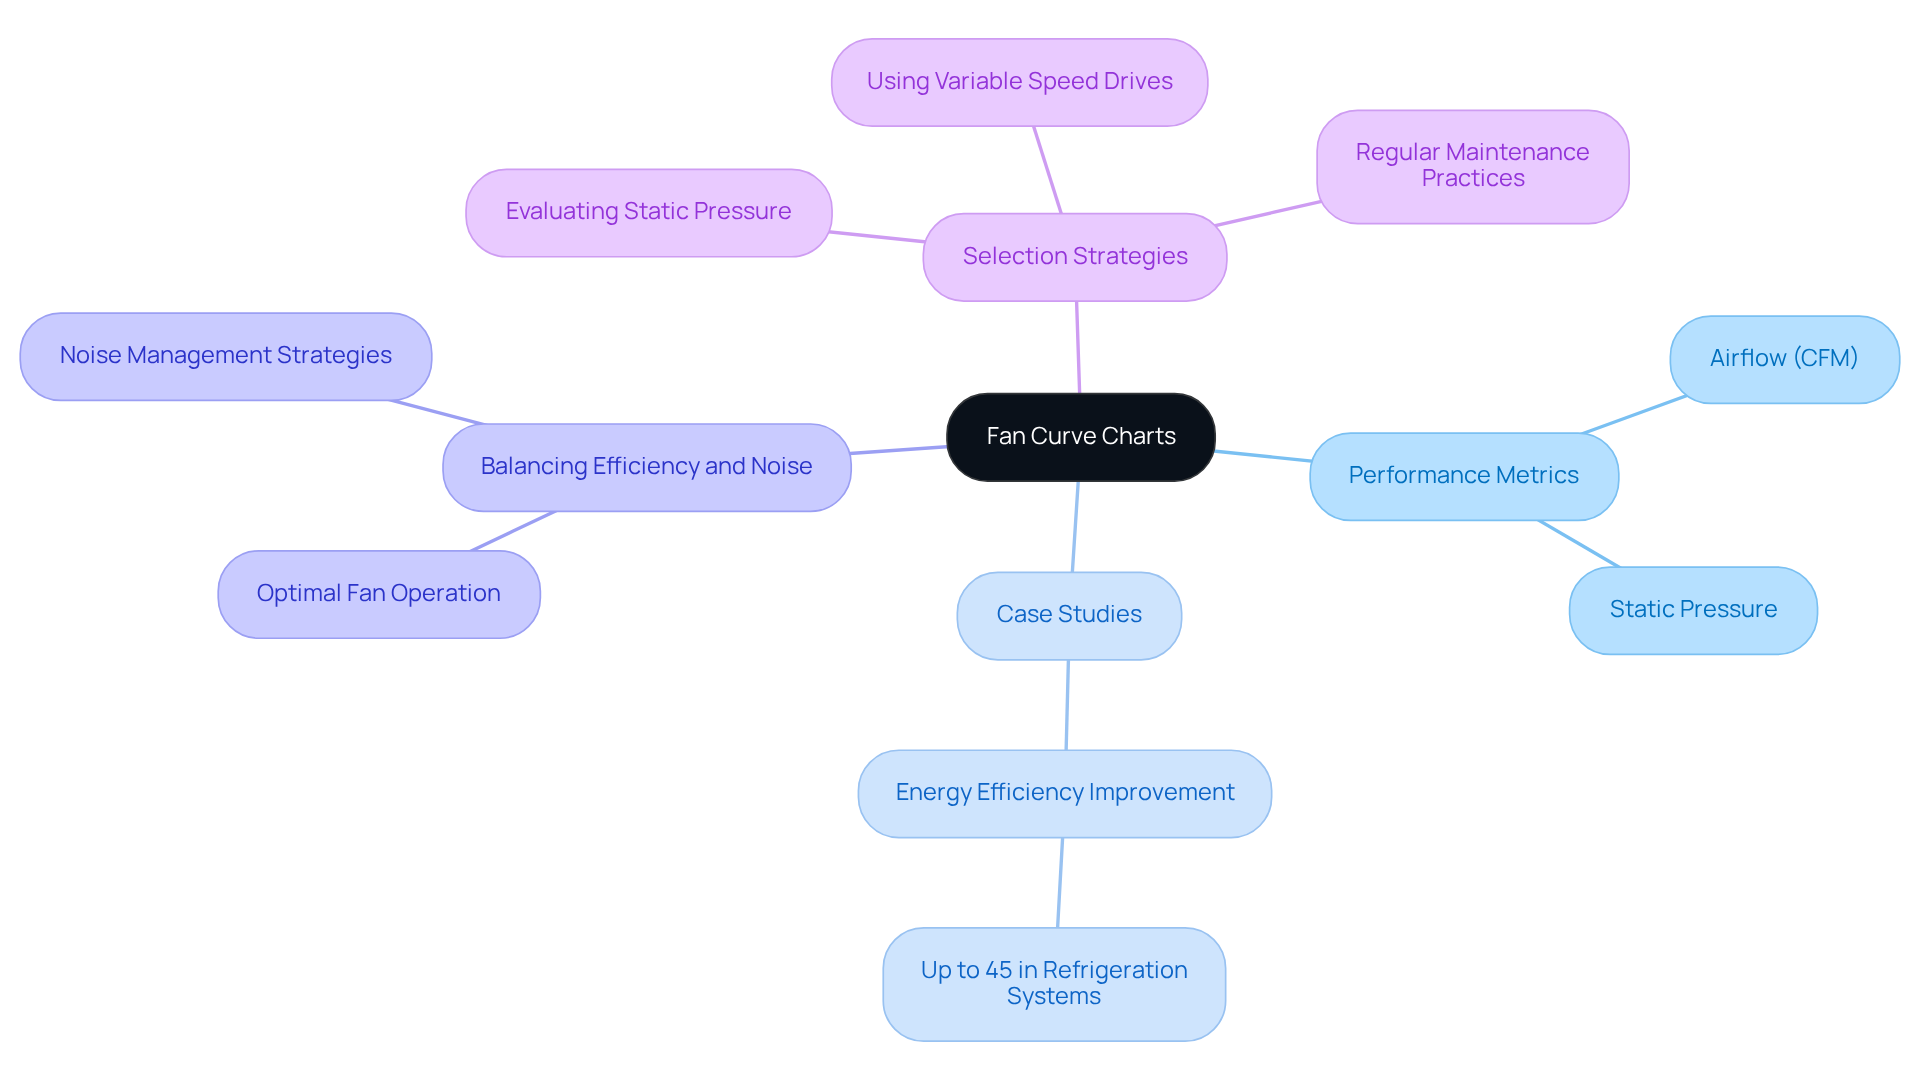
For professionals in the electronics industry, mastering the fan curve chart is essential. Understanding fan performance metrics – such as airflow measured in Cubic Feet per Minute (CFM) and static pressure – empowers professionals to make informed decisions that significantly enhance design and functionality.
For example, case studies reveal that those who effectively leverage fan curve data can optimize cooling solutions, achieving energy efficiency improvements of up to 45% in refrigeration systems. This remarkable enhancement is directly linked to their understanding of the fan curve chart. Such knowledge not only aids in selecting the right ventilators for specific applications but also ensures that systems operate efficiently, reducing the risk of overheating and extending the lifespan of electronic components.
Moreover, a solid understanding of the fan curve chart allows professionals to achieve a balance between cooling efficiency and noise levels. A well-defined fan curve chart ensures effective fan operation without excessive noise, which has become increasingly important as industries turn to advanced cooling solutions. The ability to interpret fan performance data is becoming a critical factor in driving innovation and achieving project success.
Additionally, engineers must evaluate static pressure alongside airflow metrics when selecting fans. Practical strategies, such as regular maintenance and the implementation of variable speed drives, can further enhance fan efficiency. By adopting these approaches, professionals can ensure optimal performance and reliability in their cooling systems.
Conclusion
Mastering fan curve charts is essential for electronics engineers, as these charts offer critical insights into fan performance, energy efficiency, and system optimization. Understanding the intricate relationships between airflow, static pressure, and power consumption enables engineers to make informed decisions that enhance the reliability and efficiency of their cooling systems.
Key insights discussed in this article underscore the significance of various factors, including the three fan laws, static pressure, brake horsepower, and the integration of system curves. These elements collectively empower engineers to select the most suitable fans for their applications, ensuring optimal performance while minimizing energy costs. The role of variable speed fans and efficiency curves further emphasizes the need for adaptability in design, facilitating improved thermal management across diverse environments.
Ultimately, effectively applying fan curve charts in equipment selection streamlines the design process and drives innovation in cooling solutions. As the demand for energy-efficient systems continues to rise, engineers are encouraged to deepen their understanding of fan performance metrics. Leveraging this knowledge will lead to sustainable and cost-effective outcomes in their projects.
Frequently Asked Questions
What is the purpose of Gagner-Toomey Associates in relation to fan curve charts?
Gagner-Toomey Associates provides innovative solutions to help professionals navigate the complexities of fan curve charts by offering access to top-tier manufacturers and advanced technologies in cooling, power management, and interconnect solutions.
How does Gagner-Toomey Associates support technicians in their work?
They utilize a consultative approach and responsive customer service to equip technicians with the necessary tools and knowledge for optimizing fan selection and application across various projects, thereby simplifying the decision-making process and enhancing system performance.
What is a fan curve chart and why is it important for engineers?
A fan curve chart visually illustrates the relationship between flow rate (CFM), static pressure (SP), and fan speed (RPM). It is essential for engineers as it helps in the precise selection of fans tailored to specific system requirements, ultimately influencing airflow dynamics and the performance of electronic devices.
What is the Fan Energy Index (FEI) and its significance?
The Fan Energy Index (FEI) is a vital metric that helps engineers identify energy-efficient blowers, enhancing overall performance and energy consumption in cooling systems.
What are the three fan laws and why are they important?
The three fan laws are: 1. Airflow (CFM) is directly proportional to RPM. 2. Total static pressure changes with the square of the airflow (or RPM). 3. Brake horsepower (BHP) varies with the cube of the airflow. These laws are important for analyzing fan performance and predicting how changes in fan speed affect air movement and pressure, which is crucial for designing efficient systems.
How does increasing fan speed affect power and static pressure?
Increasing fan speed by 10% results in a 33% increase in power and a 21% rise in static pressure, highlighting the energy implications of speed modifications.
What is the Operating Point on a fan curve chart?
The Operating Point is the intersection of static pressure and air movement on the fan curve chart, which helps professionals optimize performance in their applications.

